
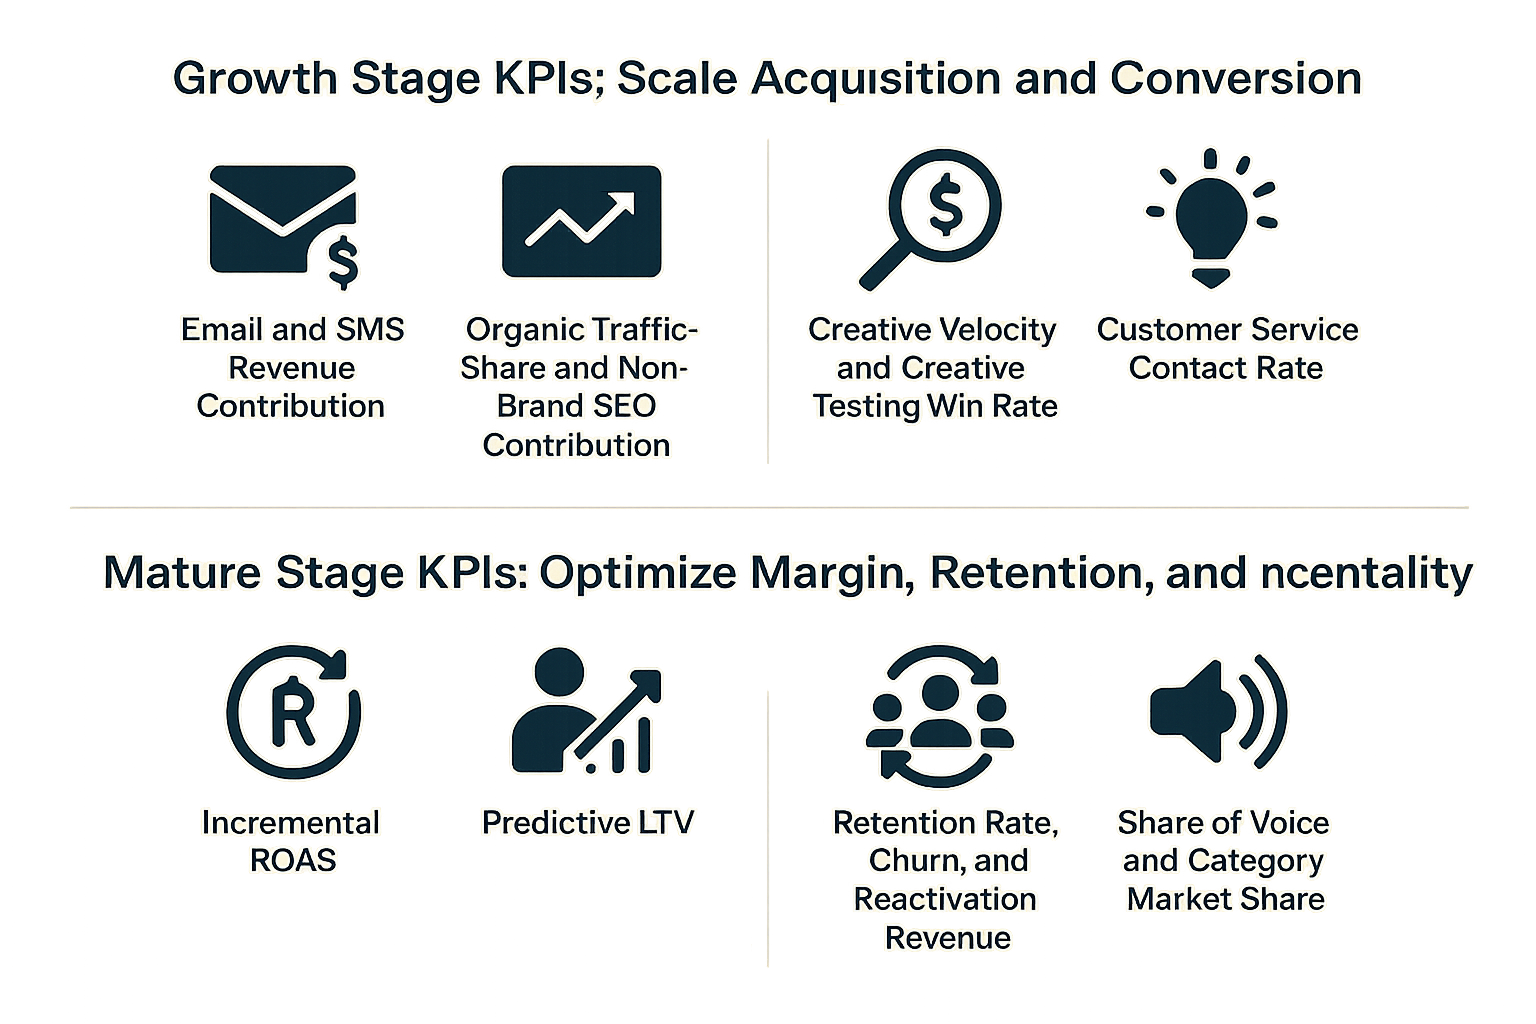
Not every KPI matters equally at every stage of a business. The right e-commerce KPIs by business stage can mean the difference between scaling profitably and burning runway on vanity metrics. A pre-revenue DTC startup obsessing over customer lifetime value (LTV) is wasting analytical horsepower it could be spending on channel-market fit. A mature $50M brand still measuring success by follower count is leaving margin on the table. The metrics that signal success in year one can quietly become vanity metrics in year five, and the KPIs that mature brands live and die by are often meaningless when you have 400 total customers.
This guide breaks down the digital marketing and e-commerce KPIs that matter at three distinct business stages\u2014startup, growth, and mature\u2014with benchmark ranges drawn from published industry data. Whether you\u2019re a founder building a measurement stack from scratch or a marketing leader auditing an existing dashboard, use this as a stage-appropriate scorecard.
Key Takeaways
- Stage dictates metric selection: Startups measure survival signal, growth-stage brands measure scalable efficiency, mature brands measure incrementality and margin.
- Startup KPIs prove the model: Focus on cold conversion rate, CAC vs. first-order AOV, 90-day payback, and branded search growth.
- Growth-stage KPIs scale what works: MER, CM2, cohort repeat rates, and creative velocity replace simple ROAS.
- Mature brands measure truth: Incremental ROAS, predictive LTV, share of voice vs. share of market, and media mix modeling separate real value from attributed noise.
- Dashboard discipline matters: Executive dashboards should track 8\u201312 KPIs maximum; over 40 signals paralysis.
- Revisit every six months: KPI stacks must evolve with the business or they quietly mislead leadership.
Why Stage-Based KPIs Beat One-Size-Fits-All Dashboards
Stage-based KPIs outperform generic dashboards because the strategic question changes at each phase of business maturity. Startups measure whether the model works, growth-stage brands measure whether it scales, and mature brands measure whether it compounds value. Applying the wrong stage\u2019s metrics wastes analytical capacity and misdirects investment.
Roughly 20% of new businesses fail within their first year, and about 65% fail within 10 years, according to U.S. Bureau of Labor Statistics data cited widely by business analysts [Statista, 2024]. A meaningful driver of that failure is misaligned measurement: teams either measure too much and act on nothing, or measure the wrong things and optimize themselves into a corner.
Gartner\u2019s CMO Spend Survey has consistently found that CMOs are under pressure to demonstrate financial impact, with marketing budgets averaging around 7.7% of company revenue in 2024, down from prior peaks [Gartner, 2024]. That pressure only intensifies the need to measure what actually moves the needle at your current stage.
McKinsey research on high-growth companies shows that firms that outperform peers are 1.7x more likely to have a clearly defined performance measurement approach tied to strategic priorities [McKinsey Digital, 2023]. Stage-appropriate KPIs are the operational expression of that principle.
How Do You Identify Your Business Stage?
Before applying any benchmark, place your business honestly:
- Startup stage: Under ~$1M ARR (or under ~$500K for DTC e-commerce), fewer than 5,000 customers, still testing product-market fit, primarily founder-led marketing, one or two paid channels.
- Growth stage: Roughly $1M\u2013$20M ARR, product-market fit established, 3\u201310 marketing channels active, first dedicated hires in paid media, lifecycle, and analytics, expanding beyond a single geography or category.
- Mature stage: $20M+ revenue, multiple product lines, repeatable acquisition machine, retention and margin optimization as central concerns, potentially retail or wholesale expansion, sophisticated measurement infrastructure.
What Happens When You Apply the Wrong Stage KPIs?
Applying mature-stage KPIs at startup wastes precious analyst time on models that lack statistically significant data. Conversely, running a mature brand on startup KPIs leaves millions in optimization opportunity on the table. The clearest symptom of misalignment: dashboards that don\u2019t change decisions.
Startup Stage KPIs: Prove the Model

At startup stage, KPIs answer one question: does anyone want this and can we sell it profitably enough to survive? The four essential metrics are cold conversion rate, CAC vs. first-order AOV, first-order payback period, and branded search growth. You do not need attribution science\u2014you need signal.
What Is a Good Conversion Rate for a Startup?
Average e-commerce conversion rates hover between 2.5% and 3%, with top-quartile stores exceeding 4.5% according to multiple industry surveys [Shopify, 2024]. Startups should target at least 1.5% on cold paid traffic during the first six months. Anything below 1% consistently, after optimizing landing pages, usually indicates a product-message-market mismatch rather than a media problem.
How Should Startups Measure CAC vs. First-Order Value?
Mature DTC brands aim for a blended CAC-to-LTV ratio of 1:3. Startups don\u2019t have enough repeat data to trust LTV, so a better early metric is CAC versus first-order average order value (AOV). If your first-order AOV covers CAC plus COGS with even a thin margin, you have a survivable model. If not, you\u2019re subsidizing every customer with runway.
According to Shopify\u2019s research, average e-commerce AOV sits around $100\u2013$150 depending on category [Shopify, 2024]. Startups selling anything below $50 AOV usually cannot make paid social profitable early and must lean on organic or content-led acquisition.
What Is a Healthy First-Order Payback Period?
Klaviyo\u2019s benchmark data across thousands of e-commerce brands shows that repeat purchase behavior begins to reveal itself within 60\u201390 days [Klaviyo, 2024]. Startups should target a first-order payback period under 90 days. Longer paybacks are permissible for subscription models but demand tighter churn control.
Why Does Branded Search Volume Matter Early?
Even for paid-first startups, tracking branded search volume monthly is a leading indicator of brand pull. Ahrefs data indicates that branded queries typically convert at 2\u20135x the rate of non-branded queries [Ahrefs, 2023]. Watching branded search rise month over month is often the earliest quantitative signal of product-market fit.
Email List Growth Rate and First-Purchase Attribution
Mailchimp\u2019s benchmark reports show average email open rates in retail around 35% and click-through rates near 2.5% [Mailchimp, 2024]. Startups should focus less on those rates and more on list growth velocity: are you adding subscribers 20%+ month over month, and are welcome-flow-sourced first purchases exceeding 15% of new-customer revenue? That combination signals that owned media can eventually reduce dependence on paid.
Qualitative Metrics That Actually Count
- NPS or CSAT on first 100 orders: An NPS above 40 in early cohorts predicts retention, per Bain\u2019s research replicated across DTC contexts.
- Product return rate: Apparel benchmarks sit near 24.4% per National Retail Federation data cited across industry publications [Digital Commerce 360, 2024]. Startups above category norms have a product problem, not a marketing problem.
- Unsolicited word-of-mouth mentions: Track referral-code redemptions and \u201chow did you hear about us\u201d survey responses weekly.
KPIs to Ignore at Startup Stage
- Multi-touch attribution models (you don\u2019t have the data volume)
- Blended MER at platform granularity (channels are too few)
- LTV projections beyond 12 months
- Follower counts as primary success metrics
Growth Stage KPIs: Scale What Works

Growth-stage KPIs prove you can find profitable customers repeatably. The critical metrics are Marketing Efficiency Ratio (MER), contribution margin after marketing (CM2), cohort repeat rates, and channel-level LTV:CAC. Diagnostic depth matters more than dashboard breadth at this stage.
How Do You Calculate Marketing Efficiency Ratio (MER)?
MER (total revenue \u00f7 total marketing spend) becomes the north-star efficiency metric because iOS 14.5+ and cookie deprecation have compressed the reliability of platform-level ROAS. Post-iOS 18, Meta and Google both under-report conversions by 15\u201340% depending on category and consent posture [Meta for Business, 2024]. Growth-stage brands typically target blended MER of 3.0\u20135.0x, with 4.0x as a common healthy midpoint. Category matters: consumables can operate profitably at MER 2.5x if repeat rates are strong, while high-ticket single-purchase categories may need 6x+ blended MER.
Why Separate New Customer CAC From Repeat Customer CAC?
By growth stage, you should be reporting these separately. Klaviyo\u2019s data across DTC brands shows repeat-customer CAC (via email, SMS, retention flows) typically runs at 15\u201325% of new-customer CAC [Klaviyo, 2024]. If your ratio is worse, retention infrastructure is under-invested. If it\u2019s much better, congratulations\u2014now scale paid acquisition harder because your backend is doing the work.
What Is Contribution Margin After Marketing (CM2)?
Revenue minus COGS minus fulfillment minus marketing equals CM2. This is the single most important metric for growth-stage DTC brands because it exposes whether growth is actually creating enterprise value. Healthy growth-stage CM2 typically sits between 15% and 30%. Brands scaling revenue while CM2 shrinks are effectively purchasing revenue with equity dilution.
Cohort Repeat Rates at 30, 60, and 90 Days
Shopify Plus merchants demonstrate that the top 10% of DTC brands see 30%+ of new customers reorder within 90 days [Shopify Plus, 2023]. Growth-stage brands should be tracking cohort-level repeat behavior monthly, not aggregate repeat rates. A rising 90-day repeat rate in newer cohorts is the strongest predictor of long-term unit economics improving.
Channel-Level LTV:CAC by Cohort
Instead of a single LTV:CAC number, growth-stage brands calculate the ratio by acquisition channel and cohort month. Meta-acquired customers often show different LTV curves than Google Search\u2013acquired or influencer-acquired customers. HubSpot research suggests that a healthy LTV:CAC ratio sits at 3:1 or higher, with under 1:1 indicating a broken model and over 5:1 potentially indicating under-investment in growth [HubSpot, 2024]. Understanding the full Book a Free Consultation